I thought I’d turn this into it’s own post to make it easier to find it.
Here’s a guide on how to Debug CADET on Windows with Visual Studio
- Set up your Visual Studio to build
cadet - Create a
launch.vs.jsonfile in thecadetroot directory with the following contents, where you only need to modify :
a. the"args"field to contain the path to the simulation .h5 file and
b. the"name". You can have multiple alternative debug configurations defined here.
{
  "version": "0.2.1",
  "defaults": {},
  "configurations": [
    {
      "type": "default",
      "project": "CMakeLists.txt",
      "projectTarget": "cadet-cli.exe (Install) (bin\\cadet-cli.exe)",
      "name": "debug simulation A",
      "args": [
        "C:\\Users\\Path\\To\\Simulation_A.h5"
      ]
    },
    {
      "type": "default",
      "project": "CMakeLists.txt",
      "projectTarget": "cadet-cli.exe (Install) (bin\\cadet-cli.exe)",
      "name": "debug simulation B",
      "args": [
        "C:\\Users\\Path\\To\\Simulation_B.h5"
      ]
    }
  ]
}
- At the top of the VS Window, set the Configuration to
DEBUGand wait for theCMakecache to regenerate. - At the top of the VS Window, next to the solid green triangle pointing right, where it says “Select Startup Item” is a small dropdown menu.

There you can select the configurations you created in thelaunch.vs.json. Now the bar at the top of VS should look like this:

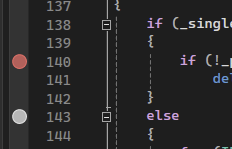
If you can’t select your configuration, the most common reason is, that theCMakecache needs to be rebuilt. - Place a breakpoint where you want to break the simulation. This is done by clicking the grey area next to the line numbers in the code editor, like this:
- Click on
debug simulation A(or however you called the configuration) to start the debugger. - If the debugger does not break at your breakpoints, use file explorer to find the files you want to break at in the folder
build\src\libcadet, drag those into VS and set breakpoints there.