Issues with running PCC file with CADET-Process on the high power computer cluster (HPC)

I am doing an optimization on my PCC model with the goal of exploring the parameter while doing it.
Here is the full PCC process for reference:
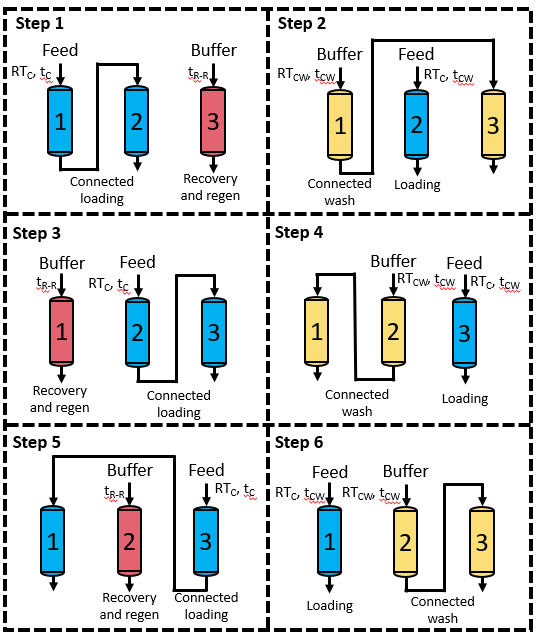

I have noticed something with the stability of the model on the HPC, caviness, the HPC that University of Delaware uses. The model seems to trouble with areas where a small or large amount of protein is loaded.
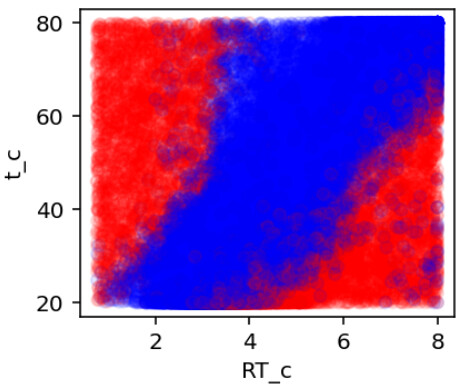
t_c is the time of loading in the odd steps and RT_c is the residence time of the feed.
t_cw is the time of the even steps and RT_cw is the flowrate of the buffer (not a variable in the optimization yet)

This is the graph for fails and succuss for the optimization. Each circle is a single simulation of the PCC script, where blue means it completed and red means it timed out. The time out for this was around 3 hours. For my local computer this should be enough time for most of those points, however what I have seen is that when CADET is ran on the HPC it takes a lot longer.

Here is a little bit of information about how we run it on the HPC. We are having to limit the amount of threads created so that we can parallelize more.

In the script running CADET we have:

os.environ[“OMP_NUM_THREADS”] = “1”
os.environ[“OPENBLAS_NUM_THREADS”] = “1”
os.environ[“MKL_NUM_THREADS”] = “1”
os.environ[“VECLIB_MAXIMUM_THREADS”] = “1”
os.environ[“NUMEXPR_NUM_THREADS”] = “1”

And in the job script we have:

for envvar in {OMP,OPENBLAS,MKL,NUMEXPR,BLIS}\_NUM_THREADS VECLIB_MAXIMUM_THREADS; do
    export ${envvar}=1
    echo "${envvar}=${!envvar}"
done

# --- force XDG dirs away from /run/user/$UID ---
export XDG_RUNTIME_DIR="$TMPDIR/xdg_runtime"
export XDG_CACHE_HOME="$TMPDIR/xdg_cache"
export XDG_CONFIG_HOME="$TMPDIR/xdg_config"
export XDG_DATA_HOME="$TMPDIR/xdg_data"
mkdir -p "$XDG_RUNTIME_DIR" "$XDG_CACHE_HOME" "$XDG_CONFIG_HOME" "$XDG_DATA_HOME"

Once again the treads are limited to be safe and the XDG dirs had to be modified so that I would not run into permission issues. For reference if we don’t limit the amount of threads, I can get a single simulation to complete since it completely stalls.

I am wondering if there is something I could do so that more of these simulations could be run?

I have attached the CADET file running it and the data, any entry where performance metrics = 0 is one where it timed out.

Caviness_PCC_Opti_Reduced_1to1_V12_new_tubing_V2_conc_600_Parameter_Population.csv (7.5 MB)
Caviness_PCC_Opti_Reduced_1to1_V12_new_tubing_V2.zip (1.5 MB)

Hi Daniella,

Sorry for the long wait; our staff has been rather busy lately.

From your post, it sounds like the main problem is that some optimization runs take so long that they exceed the 3-hour wall time on the HPC. If that is the case, I would first look at the numerical settings.

Your spatial discretization appears reasonable. If I understood your setup correctly, you are using approximately 0.01 FV cells per m, which should not exceed about 100 axial cells (ncol ) in your settings.

A quick look at your files also suggests that you are not explicitly specifying the time integration tolerances (abstol and reltol). In that case, I would recommend adjusting these tolerances to the level of accuracy that is actually required for your optimization. Relaxing these tolerances can often reduce simulation times significantly, especially for parameter combinations that define “stiff problems”, which seems to be the case.

It would also be helpful to know whether the simulations that eventually time out are still making progress or whether they appear to stall completely, e.g. at a time section transition (in which case you might want to change the consistent initialization mode). That distinction can help determine whether the issue is due to particularly difficult operating conditions, solver convergence behavior, or something specific to the HPC environment.

Best regards,
Jan

For the tubing I am using 0.01 m/col for the tubing and 20-30 ncol/npar for the column. I would like to up the column discretization but that would slow down the simulation too much. Even when we up timeout to 24 hours or longer we still see have this problem, especially at lower feed concentrations (<3 mg/mL)

How would I check if the simulation is still making progress?

Best,
Daniella

Hi Daniella,

I think this probably depends a bit on the HPC system and how it’s set up. Are you able to check whether the simulation is still actively running when it seems to hang, or if it has actually stalled, for example by looking at a resource monitor?

There is also a TIMEOUT setting in CADET-Core that might be worth playing around with:

Did you get a chance to look at the solver tolerances, as Jan mentioned? Sometimes those can have a pretty big impact on runtime.

It might also be worth trying a lower MAX_NEWTON_ITER value. That could help prevent the solver from spending too much time on difficult cases, although you’ll want to see how it affects convergence for your model.

Cheers,
Hannah

Hey,

We do use the timeout setting to avoid the optimization getting hung up on certain parameters.

I just got gdb working to see if the cadet is entering IDAStep and IDASolve to see if the solver is making progress or stalling. I just need to run those problematic parameters and see what the solver is doing. Then I am going to mess around with the solver settings.

Best,
Daniella

So I tested some conditions and it seemed like some of those red points in the graph just needed to be run for longer but some do stall out. The gdb trace showed the IDA solver not making any progress past 2 days, no more IDAStep or IDASolve entries, for one of the conditions I tested.

I also was making testing a version with just one piece of tubing and three columns so that we could hopefully test these other conditions in a timely manner and ran into a interesting issue. While I had ncol and npar being 25 for the columns, it would it the time limit of 5 minutes with a Dax of 1e-6 but when increasing it to 1e-5 it completed in ~60 seconds (for 5 cycles).

I lowered the cycles to 1 and the Dax = 1e-5 completes in ~14 seconds, 1e-6 still hits the 5 minute time limit. However when I increase the ncol and npar to 50, 1e-6 completes a cycle in ~49 seconds. Do you know what would be causing this?

Best,
Daniella

I was playing around with the integrator setting and found that either decreasing the abstol to 1e-9 works but also changing the max_newton_iter to ~100 and setting a max_step_size of ~1 also works. Right now I just have max_newton_iter = 100 but might limit the max_step_size depending on the difficulty of the conditions I am running.

Best,
Daniella

Hi Daniella,

increasing Dax by an order of magnitude often decreases the so-called “stiffness” of the system that the time integrator has to solve significantly, so the speed up you observed there makes total sense.

Increasing the number of discretization points requiring less compute time is rather unexpected. One explanation could be that the problem is underresolved with nCol = nPar = 25 for this set of parameters such that the approximation is “bad-behaved” in the sense that the stiffness is increased (e.g. strong gradient, oscillations, negative values, binding rates being significantly faster for the currently approximated values) causing the time integrator required more time steps.

With CADET v6.0.0a4, this solver meta data is printed to the meta output group if specified in the return group, allowing investigation on stiffness. More time steps and lower BDF order are strong indicators for a stiff problem.

abstol 1e-9 is more than enough, you could probably even increase that by 2-3 orders of magnitude. keep in mind to adjust the reltol accordingly.

Best regards,
Jan