Determine the adsorption isotherm parameters of the main component charge variant using CADET-MATCH

Dear CADET team, I want to estimate the NU, SIGAMA and KA of the main component charge through the experimental data of different elution gradients, however, I have met some problems in this process, and I hope you can answer them

Here’s how I did it:
Since I do not know the initial values of these data, I extract some data from the literature, for example, the value of NU is set between 5-20, the value of SIGAMA is set between 20-60, the initial value of KA=1, NU=20, SIGAMA=40, the score of Shape is selected, and the search strategy of UNSGA3 with MCMC is used.
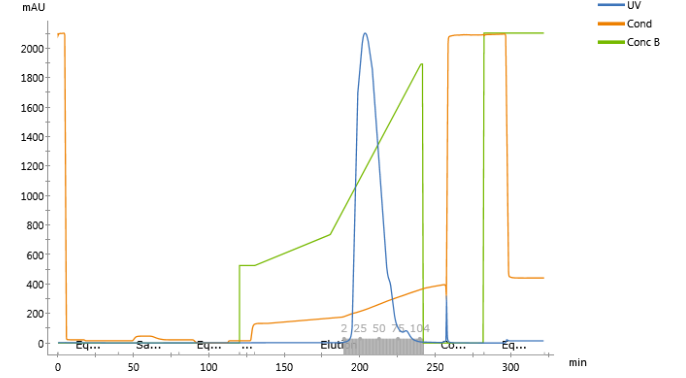
First of all, I set a large search range and got the initial search result, which was quite different from my initial value and because of the high characteristic charge value, there was a large sample peak in the elution curve, which was not reflected in my experimental data.

parameter1 = Dict()

parameter1.transform = ‘auto’

parameter1.component = 1

parameter1.bound = 0

parameter1.location = ‘/input/model/unit_001/adsorption/SMA_NU’

parameter1.min = 1

parameter1.max = 100

parameter2 = Dict()

parameter2.transform = ‘auto’

parameter2.component = 1

parameter2.bound = 0

parameter2.location = ‘/input/model/unit_001/adsorption/SMA_SIGMA’

parameter2.min = 1

parameter2.max = 1000

parameter3 = Dict()

parameter3.transform = ‘auto’

parameter3.component = 1

parameter3.bound = 0

parameter3.location = ‘/input/model/unit_001/adsorption/SMA_KA’

parameter3.min = 1e-5

parameter3.max = 1e5


Therefore, I took the search result of this time as the initial value, set the search scope as the literature reference value, and kept the other Settings unchanged with the first time. The fitting results are as follows,

parameter1 = Dict()

parameter1.transform = ‘auto’

parameter1.component = 1

parameter1.bound = 0

parameter1.location = ‘/input/model/unit_001/adsorption/SMA_NU’

parameter1.min = 5

parameter1.max = 20

parameter2 = Dict()

parameter2.transform = ‘auto’

parameter2.component = 1

parameter2.bound = 0

parameter2.location = ‘/input/model/unit_001/adsorption/SMA_SIGMA’

parameter2.min = 20

parameter2.max = 60

parameter3 = Dict()

parameter3.transform = ‘auto’

parameter3.component = 1

parameter3.bound = 0

parameter3.location = ‘/input/model/unit_001/adsorption/SMA_KA’

parameter3.min = 1e-5

parameter3.max = 1e5


As it can be seen from the corner picture of the folder, is it because I have too large a range of SIGMA values that lead to multiple peaks? Now that you can see that the shape of my experimental data is very similar to that of the simulated data, how should I set the range and optimize the parameters next since I’ve tried a number of methods and I can’t get a good fit of the height?


At the same time, I also used another data for inverse fitting, and the difference between it and the first one is that the elution gradient is steeper.
Different from the above process, the experimental data can coincide well with the fitting data after the search scope is narrowed, but there is still a large sample peak. How can I improve this? As different experiments of the same sample, why are the NU and SIGMA values of the two experiments so different?

0923_3.ipynb (5.8 MB)
0923_main (2).csv (993 Bytes)
These are my experimental data and code for the first time.

Hi Ally,

It looks like the area of the elution peak in your Second_Result plot is different between the simulation and the data from the experiment. Are you sure you are running the simulation with the correct mass loading of protein? The mass balance doesn’t appear to work out. In the other plots, there is breakthrough of the protein during the loading phase which you don’t appear to have data in. I think your csv file has data only for the elution phase. This also suggests that your mass loading in the simulation may not be correct - did you have breakthrough in the experiment?

If the loading is wrong, it is not possible to obtain a peak that has the same height and shape (assuming the protein elution recovery is the same). So, you should definitely check to confirm this.

Not completely sure about the double peak - but, considering that you only have one protein component and that this is not the multi-state SMA, a peak hump could arise from the particular distribution of protein in the column or from the values you used for pore & surface diffusion.

A few more notes… the shape of the salt gradient looks odd. Are you sure it is correct?

The plot labels are not correct - it should be salt on the left and protein on the right.

Hope this helps!

2 Likes

Hi, Alters!
I didn’t have breakthrough in the experiment as you can see in the as you can see from the AKTA record also the shape of the salt gradient was fine based on the curve of conductivity.
2022-12-07_191455
And I’m not using a single protein component, a monoclonal antibody with a different charge variants is what I used. Based on the elution fractions, I conducted HPLC analysis and determined it as the main component according to certain purity. That’s I wanted to use the model for fitting.This also explains why my experimental data only have elution data points. Silly me for mixing up labels.
Maybe I gave the sample at the total protein concentration in the inlet profile, I’ll change it and try again.
Once again, thank you for your patient response

Ah I see, didn’t realize you had multiple components. When I am dealing with multiple components I usually do fitting for each individual protein’s isotherm parameters (so that we get closer to the solution) and afterwards fit the parameters for all components simultaneously - “sequential components vs. all components”. Looking at this data, I think you should be performing fitting for the mAb and basic charge variant.

Importantly, there is no breakthrough in the data but you have breakthrough in your sim - so the loading must off, possibly by a lot. I would calculate the mass of protein in the elution peak (either from offline concentration measurements like nanodrop spectrophotometer, or from the AKTA UV trace - take care to consider detector nonlinearity!)

Ideally, the loading should be known - based on the concentration of your load material, duration of loading phase, and the hold-up of the tubings between injection valve and the column inlet - and you should have the same mass in the sim and experiment. It’s a good sanity check to make sure that the calculated mass from the peak area matches with this.

If you gave the concentration for the mAb as the total protein concentration, that could definitely cause your issue (based on what I’ve seen - mAb is 60-70% of this kind of feed).

Lastly, if you want to determine the SMA parameters you should ideally use multiple experiments that have different gradient slopes (e.g. 20, 40, 60 CV LGE) and a step elution run at a moderate salt concentration (some value between the elution moments of the components). You can also use breakthrough experiments if you want to determine steric factor more accurately because it can be difficult to reasonably determine this parameter without having any breakthrough in the loading phase. That might be why your ranges for steric factor were broad. If you know the characteristic charge, ionic capacity, and approximate q_max - you can estimate steric factor via q_max = lambda/(nu + sigma). Also, take care to consider the porosities and transport parameters appropriately :slight_smile:

Let me know if you have any more questions.

Scott

3 Likes

Thank you so much for being so patient with my questions! And yes, fitting for the mAb and basic charge variant is my purpose. I will try to change my injection concentration and add breakthrough experiment to improve my model just as you suggested.

2 Likes

Hi, Scott!

Here I am again with my silly questions:

According to your suggestions, I conducted the elution experiment of 10cv, 40cv, 60cv and one STEP, and fitted the parameters according to the experimental results. I have encountered some problems according to the fitting results, so I am seeking your help and hope that you can take the trouble to help me solve it

1.Large difference in adsorption constants between different batches: According to the results of best_plot, I found that the values of the four batches of experiments are very close to each other when fitting the characteristic charge values, and the shielding factor has a single-digit error which is acceptable, but there is a big difference in adsorption constant and analytical constant. Eg.40CV has a KA value of 4464 and a KD value of 2.90e7, but at 60CV, the KA value has 33714 and the KD value has 2.62e8. I notice in the document that the reference concentration is used, is this KA,KD value not the actual adsorption constants, what I need to determine is this ratio of KA to KD? Or should I look for these batches of similar results from result.csv because the fitting range I selected expanded and results in different ranges appeared?

2.Parameters of the reference model created when fitting: I changed the value of the reference model I create based on the result of a single fit. Is this the right thing to do? Or do I need to fix the values of the reference model and then change the fit scope and increase the number of iterations?

Thanks!

Ally

The equilibrium constant, i.e. the ratio of k_a and k_d, is quite similar for both gradients. The relatively large values of k_a and k_d indicate that the process is in rapid equilibrium and you will get the same results when using the option IS_KINETIC = 0 and arbitrarily setting k_d=1.

You can read here how to convert adsorption and desorption constants with and without reference concentrations.

1 Like

Hi Ally,

No such thing as silly questions.

Are you fitting each experiment separately or fitting them all with the same set of isotherm parameters? The correct approach here is to fit the whole set of experiments simultaneously with the same set of isotherm parameters. Time permitting, you can generate multiple sets of isotherm parameters by performing multiple batches of fitting on the entire set of experiments—providing more confidence in the regressed parameters (a straightforward way to obtain confidence intervals as well). Additionally, I do not recommend fitting both kA and kD because these parameters are absolutely correlated to each other, which will result in high variability between different batches of fitting and not provide any benefit. What you can do is to set kD equal to 1 and only fit kA. This is essentially equivalent to using Keq for kA because Keq = kA/kD. This way you only end up fitting kA (Keq), nu, and sigma.

1 Like

Thank you so much!!! This completely solved my confusion. I had been fitting each experiment separately, and there was always a big difference in KA and KD values. Now I know! I’ll give it a try as
you suggested!

1 Like